Protect Elasticsearch with Cilium network policies (eBPF)
In this blog post, I will show you how easy it is to limit access to your Elasticsearch cluster in Kubernetes when you are using Cilium. As a side note: of course I know that Elastic has its own ways of limiting access, which are not all without a license (fee), so this post is not to be read as “this is how you limit access to Elasticsearch”, but as “Hey this is fun, you can use Cilium” to secure your Elasticsearch cluster.
What is Cilium
Cilium is open source software for transparently securing the network connectivity between application services deployed using Linux container management platforms like Docker and Kubernetes. At the foundation of Cilium is a new Linux kernel technology called eBPF (extended Berkeley Packet Filter), which enables the dynamic insertion of powerful security visibility and control logic within Linux itself. Because eBPF runs inside the Linux kernel, Cilium security policies can be applied and updated without any changes to the application code or container configuration.
What is eBPF
eBPF is a revolutionary technology that can run sandboxed programs in the Linux kernel without changing kernel source code or loading kernel modules. By making the Linux kernel programmable, infrastructure software can leverage existing layers, making them more intelligent and feature-rich without continuing to add additional layers of complexity to the system or compromising execution efficiency and safety.
To dive into eBPF goes beyond the scope of this blog post. If you are into Linux, networking and security, and you have not yet heard of it, please do yourself a favor and spent some time learning at least the basics. In my humble opinion, eBPF will have a great impact on Linux, networking and security in the future, I think for example that it will replace (parts of) iptables and other tools that are used for tracing and profiling and observability and monitoring.
Lab environment
For this blog post, I installed Elasticsearch, Kibana and fluent-bit from Helm charts, all in one namespace on my Kubernetes cluster, which is installed using mosibi-kubernetes.
helm repo add elastic https://helm.elastic.co
kubectl create namespace logging
helm install --namespace logging --set persistence.enabled=false elasticsearch elastic/elasticsearch
helm install --namespace logging kibana elastic/kibana

helm repo add fluent https://fluent.github.io/helm-charts
helm install --namespace logging fluent-bit fluent/fluent-bit
Kibana and Fluent Bit
Kibana is a web-based graphical user interface for Elasticsearch, which has become the defacto standard to visualize data from Elasticsearch and Fluent Bit is a log processor and forwarder which allows you to collect logs from different sources like containers and send them to multiple destinations. In this lab environment, Fluent Bit reads the logging from containers and sends it to Elasticsearch, which is a very common setup in Kubernetes land.
Ingress
Although not necessary, I also created the following ingress rules so that I can reach http://kibana.example.com and http://elasticsearch.example.com from my laptop.
apiVersion: traefik.containo.us/v1alpha1
kind: IngressRoute
metadata:
  name: elasticsearch-ingress
  namespace: logging
spec:
  entryPoints:
  - web
  routes:
  - kind: Rule
    match: Host(`elasticsearch.example.com`)
    services:
    - kind: Service
      name: elasticsearch-master
      port: 9200
---
apiVersion: traefik.containo.us/v1alpha1
kind: IngressRoute
metadata:
  name: kibana-ingress
  namespace: logging
spec:
  entryPoints:
  - web
  routes:
  - kind: Rule
    match: Host(`kibana.example.com`)
    services:
    - kind: Service
      name: kibana-kibana
      port: 5601
Policies
As I wrote earlier, in this post I will show you how to limit access to Elasticsearch using Cilium, and then specifically using the OSI layer 3 filtering where the filtering is done based on an ip address or Kubernetes label and on layer 7, where I explicitly allow access to certain Elasticsearch endpoints.
The following policies will be created:
- Fluent-bit pods are allowed to inject data into Elasticsearch
- The Kibana deployment which lives in the logging namespace has complete access to Elasticsearch
- Access to the Elasticsearch cluster health API will be allowed from everywhere.
- Access to the logstash index will be allowed from the default namespace. The logstash index is automatically created by Fluent Bit and contains the log output from containers.
When an allow policy is set, all other traffic is not allowed anymore, so I also have to create a policy to allow the Elasticsearch nodes to talk to each other.
Elasticsearch internal traffic
The first policy I need to create, is the one that allows the Elasticsearch nodes to talk to each other, otherwise your cluster will become red very soon!
cat <<EOF | kubectl -n logging apply -f -
apiVersion: "cilium.io/v2"
kind: CiliumNetworkPolicy
metadata:
  name: "elasticsearch-allow-internal-cluster-traffic"
spec:
  description: "Allow Elasticsearch cluster nodes to talk to each other"
  endpointSelector:
    matchLabels:
      app: elasticsearch-master
  ingress:
  - fromEndpoints:
    - matchLabels:
        app: elasticsearch-master
EOF
This is a simple layer 3 ingress policy that defines, that traffic to the elasticsearch pods is allowed from nodes which have a label app: elasticsearch-master, the ‘to’ part is specified with an endpointSelector. After you apply this policy, every other traffic to the endpoint elasticsearch-master is denied, which in this case is exactly what I want :).
A Cilium endpointSelector selects all endpoints with a matching label and the Cilium terminology specifies that an endpoint is a Kubernetes Pod with an ip address. In other words, common Kubernetes labeling.
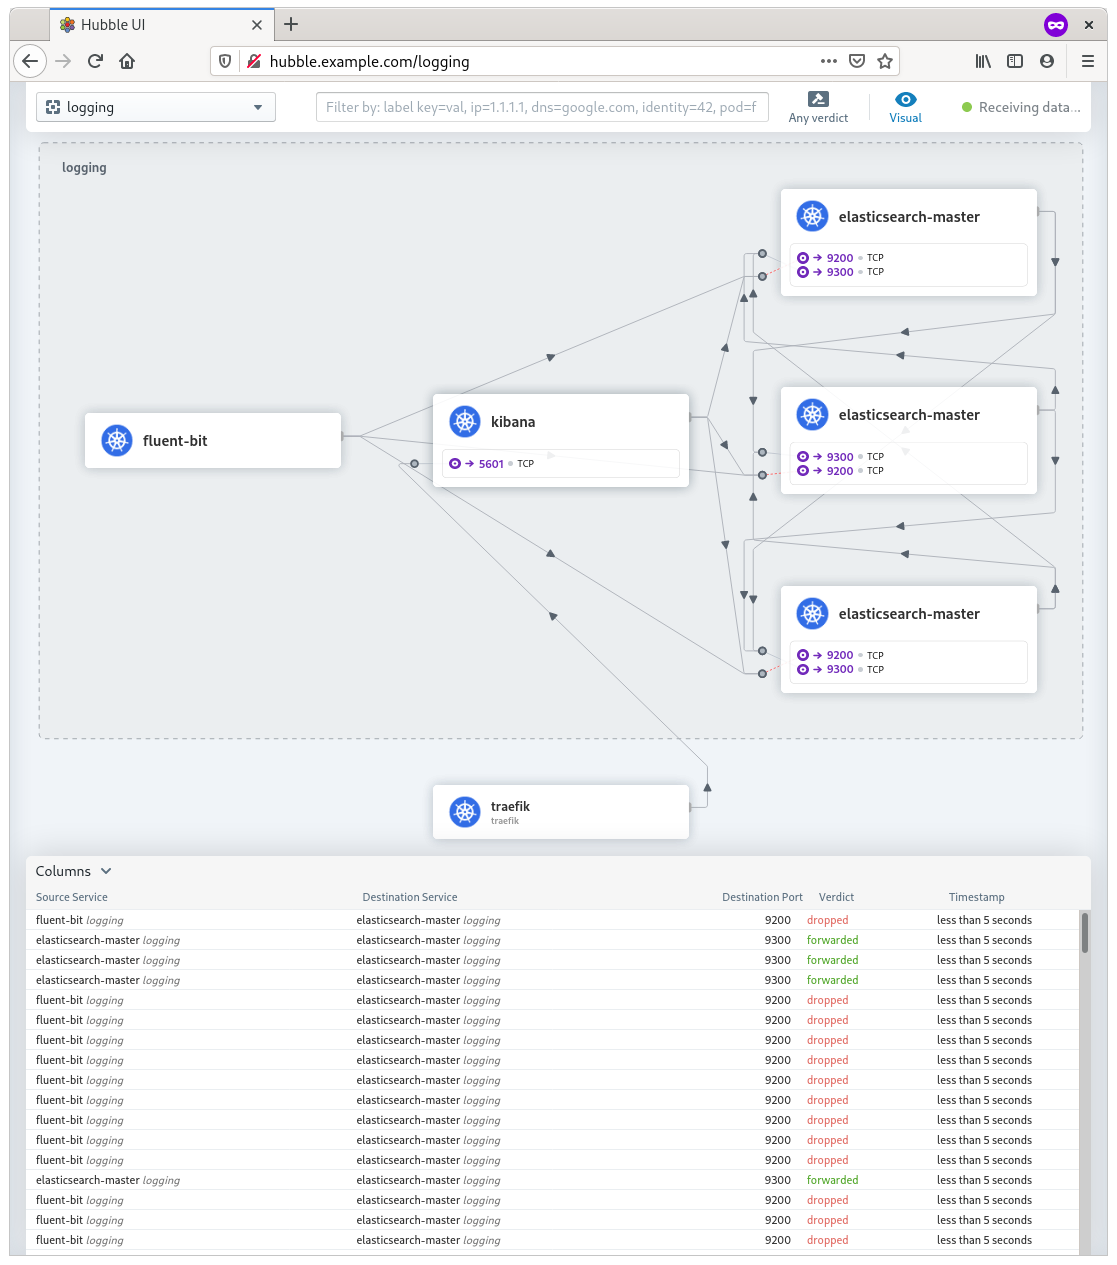
Hubble
An other product from Cilium is Hubble which is a product with a graphical web interface that gives deep visibility into the communication and behavior of services as well as the networking infrastructure. After applying our first policy, it is clearly visible in Hubble that traffic from the fluent-bit pods is dropped immediately, and that the internal traffic between the Elasticsearch pods is allowed (forwarded)
Fluent Bit
Fluent Bit is installed with the default configuration using a Helm chart. That default configuration reads container logs files from /var/log/containers/*.log and the log output from systemd unit kubelet.service and send it to Elasticsearch host elasticsearch-master, which is a Kubernetes services that load-balances over the Elasticsearch masters, in index logstash. The following layer 3 policy allows Fluent Bit to talk to the Elasticsearch masters and there are no limitations on the index it wants to write to.
cat <<EOF | kubectl -n logging apply -f -
lang=shell
apiVersion: "cilium.io/v2"
kind: CiliumNetworkPolicy
metadata:
  name: "elasticsearch-allow-fluent-bit"
spec:
  description: "Allow fluent-bit access to Elasticsearch"
  endpointSelector:
    matchLabels:
      app: elasticsearch-master
  ingress:
  - fromEndpoints:
    - matchLabels:
        "k8s:app.kubernetes.io/name": fluent-bit
EOF
After the policy is applied, you should see data coming into the logstash index. You can see that in Kibana, or using a curl command against one of the Elasticsearch masters:
$ kubectl -n logging exec -ti elasticsearch-master-0 -- curl http://elasticsearch-master:9200/_cat/indices?v
health status index                           uuid                   pri rep docs.count docs.deleted store.size pri.store.size
green  open   logstash-2021.01.10             pkKioML8RvahFk1rB_mvNA   1   1       1147            0      1.2mb        750.6kb
green  open   .apm-custom-link                jE3ju5xpQYOFV_yMZsrQQg   1   1          0            0       416b           208b
green  open   .kibana_task_manager_1          MAWaGn6rTtm2piukCKQP_g   1   1          5           15    120.5kb           64kb
green  open   .kibana-event-log-7.10.1-000001 IrszLTlcSCerl5RxzBr10w   1   1          1            0     11.1kb          5.5kb
green  open   .apm-agent-configuration        BzQZ8pmDRAa_OaR8e9vhsQ   1   1          0            0       416b           208b
green  open   .kibana_1                       jnCvQX68TtuO3Tybihk2UQ   1   1          8            0      4.2mb          2.1mb
Kibana
Kibana can be used to display Elasticsearch data and to manage the Elasticsearch stack, therefor it needs full access. The following layer 3 policy accomplices that.
cat <<EOF | kubectl -n logging apply -f -
apiVersion: "cilium.io/v2"
kind: CiliumNetworkPolicy
metadata:
  name: "elasticsearch-allow-kibana"
spec:
  description: "Allow kibana access to Elasticsearch"
  endpointSelector:
    matchLabels:
      app: elasticsearch-master
  ingress:
  - fromEndpoints:
    - matchLabels:
        app: kibana
EOF
Elasticsearch cluster health API
The following network policy is a layer 7 policy that allows the HTTP method GET on _/cluster/health.*. By using this wildcard notation, I give access to the bare health API as well as all methods behind it. For example, all of these curl commands are allowed with this policy:
curl http://elasticsearch.example.com/_cluster/health
curl http://elasticsearch.example.com/_cluster/health?pretty
curl http://elasticsearch.example.com/_cluster/health/logstash-2021.01.10?level=shards
cat <<EOF | kubectl -n logging apply -f -
apiVersion: "cilium.io/v2"
kind: CiliumNetworkPolicy
metadata:
  name: "elasticsearch-allow-cluster-endpoint"
spec:
  description: "Allow HTTP access to Elasticsearch _cluster endpoint"
  endpointSelector:
    matchLabels:
      app: elasticsearch-master
  ingress:
  - fromEntities:
    - "all"
    toPorts:
    - ports:
      - port: "9200"
        protocol: TCP
      rules:
        http:
        - method: "GET"
          path: "/_cluster/health.*"
EOF
In the previous Cilium network policies, I used fromEndpoints together with a Kubernetes label to select from where certain traffic is allowed. In this policy, I use fromEntities which has a list of pre-defined entities that are known by Cilium, for example host, cluster and world. In this policy the pre defined entity all is used:
The “all” entity represents the combination of all known clusters as well world and whitelists all communication.
Access to the logstash indices from the default namespace
Where all the previous policies, are policies that set the base to get a working cluster and allow basic communication with it, this policy allows access from an application living in the default namespace to access data in the logstash indices.
cat <<EOF | kubectl -n default apply -f -
apiVersion: "cilium.io/v2"
kind: CiliumNetworkPolicy
metadata:
  name: "elasticsearch-allow-access-to-logstash"
spec:
  description: "Allow HTTP access to the Elasticsearch logstash index"
  endpointSelector:
    matchLabels:
      app: elasticsearch-master
  ingress:
  - fromEndpoints:
    - matchLabels:
        "k8s:io.kubernetes.pod.namespace": default
    toPorts:
    - ports:
      - port: "9200"
        protocol: TCP
      rules:
        http:
        - method: "GET"
          path: "/logstash.*"
EOF
Although this is a very simple policy that only allows the HTTP method GET, it is of course possible to create more complex rule sets where for example a GET is allowed on logstash., but also a *PUT is allowed on /mydata:
rules:
  http:
  - method: "GET"
    path: "/logstash.*"
  - method: "PUT"
    path: "/mydata"
Conclusion
By now, you should have an idea about the power of the Cilium network policies and a basic understanding about how you can use Cilium to secure your applications.